As part of our Cost of Production project, we look at what costs might mean for overwintering of stock, and think about how to maximise efficiencies and promote good health and welfare for greater productivity.
Winter costs can become overwhelming. Feed, bedding, labour and health costs all mount up, so cutting back can seem like the obvious way to improve profit margins. But for Wagyu beef farmers, what happens when those savings come at the expense of growth?
The objective isn’t simply to spend less on wintering cattle, but to achieve the best possible return from the money spent. Warrendale Wagyu’s Cost of Production project analysed data from wagyu beef producers, rearers, growers and finishers across 2024, 2025 and 2026 to examine the relationship between inputs and cattle performance.
* The data presented here represent values from across the entire year, not just winter.
Here is what we found.
Feed – more spending, better results?
Higher concentrate feed expenditure did not consistently translate into faster growth or greater profitability in the data. The most profitable grower recorded below-average daily liveweight gain (DLWG) while spending relatively little on concentrate feed. Similarly, the most profitable finisher ranked only seventh for concentrate expenditure.
This suggests that feed efficiency should be assessed alongside growth, other production costs and the value of the finished animal, rather than judging performance by feed expenditure alone.
For the finishers in particular, the marbling and sales bonus played a role in overall profitability. In our previous blog post, Low-stress Grazing for Wagyu Cattle, we discussed how marbling is achieved in beef cattle. Achieving the desired marbling isn’t about diet alone. Exposure to stress and extending the finishing phase beyond that which is typical in beef systems also play a role.
Overall, in this project, more profitable grower and finisher farms generally had lower direct costs and overheads. Some also reported no bedding or haulage costs.
However, the relationship between costs and profits was not straightforward. The least profitable finishing farm also had the lowest total direct costs and the second-lowest overheads. Its poor result may partly reflect a negative bonus price, potentially linked to its low marbling score. This illustrates why cost control cannot be considered in isolation from the value of the finished animal.
The least profitable grower farm, by contrast, had above-average direct costs and overheads. One notable expense for this farm was homegrown feed and forage, largely driven by high fertiliser costs. This farm also reported higher machinery costs, potentially reflecting the equipment required to grow and harvest its own feed.
Homegrown forage can reduce reliance on purchased feed, but it is not cost-free. Seed, fertiliser, crop protection, machinery, harvesting and labour all need to be accounted for when comparing homegrown and purchased feed. Farmers should assess the full cost of producing their own forage rather than assuming it is automatically the cheaper option.
Bedding – more or less?
For producers, bedding costs averaged £10.37 per head with the most profitable producer spending a similar amount on bedding to one of the lowest performing producers. However the lowest performing rearing farm spent double the amount on bedding than that of the highest performing farm.
Substantial costs in bedding for growers and finishers did not always translate to poorer profits. However, there were notable exceptions. For the highest profitability farms in the grower and finishing stages, no bedding material was purchased. This helped saved a substantial amount in direct costs. These farms instead either housed cattle in cubicles with mattresses or overwintered them using sheltered grazing and buffer feeding at grass.
With bedding costs increasing significantly from 2024 to 2025 (by 150%) savings were made by some of the participants by housing cattle in slatted sheds or using home-produced fibre for bedding. Housing systems can therefore have a significant impact on farm costs.
Guidance recommends that calves have enough bedding to form a nest that covers their legs when they lie down. Cutting back on bedding material can impact the stress experienced by the calves particularly in cold, winter weather which in turn can affect growth and performance.
Labour – what does efficiency really look like?
Farms used a mixture of paid and unpaid (family) labour, with costs varying considerably between farms and production stages. In 2025, the difference in labour costs between the highest- and lowest-margin farms ranged from around 3.5-fold among rearers to five-fold among growers and finishers. Similar variation occurred in 2026, although the worst-performing rearers and finishers sometimes had lower labour costs than the best performers.
Paid labour was more common among the top-performing producers than in other stages. However, unpaid labour generally accounted for a larger share of costs across all four production stages.
Overall, labour expenditure did not consistently correlate with profitability. Rather than simply aiming to reduce labour costs, farmers should assess the time and cost involved in each operation and consider whether paid labour could free up time for other essential tasks. Understanding the true cost of labour can help identify opportunities to improve efficiency without compromising farm performance.
The cost per kilogram of gain
Across the 2026 year, the finishing stage had a higher cost per kilogram of liveweight gained, and growers had the least. These values are not indicative of winter costs and gains, rather an average across all seasons. The data showed the following:
- Rearer
- Liveweight gain 132 kg
- Full economic cost including calf purchase £717.05
- Cost per kg liveweight gain £5.43
- Grower
- Liveweight gain 259 kg
- Full economic cost including calf purchase £1,275.20
- Cost per kg liveweight gain £4.92
- Finisher
- Liveweight gain 190 kg
- Full economic cost including store purchase £2,085.03
- Cost per kg liveweight gain £10.97
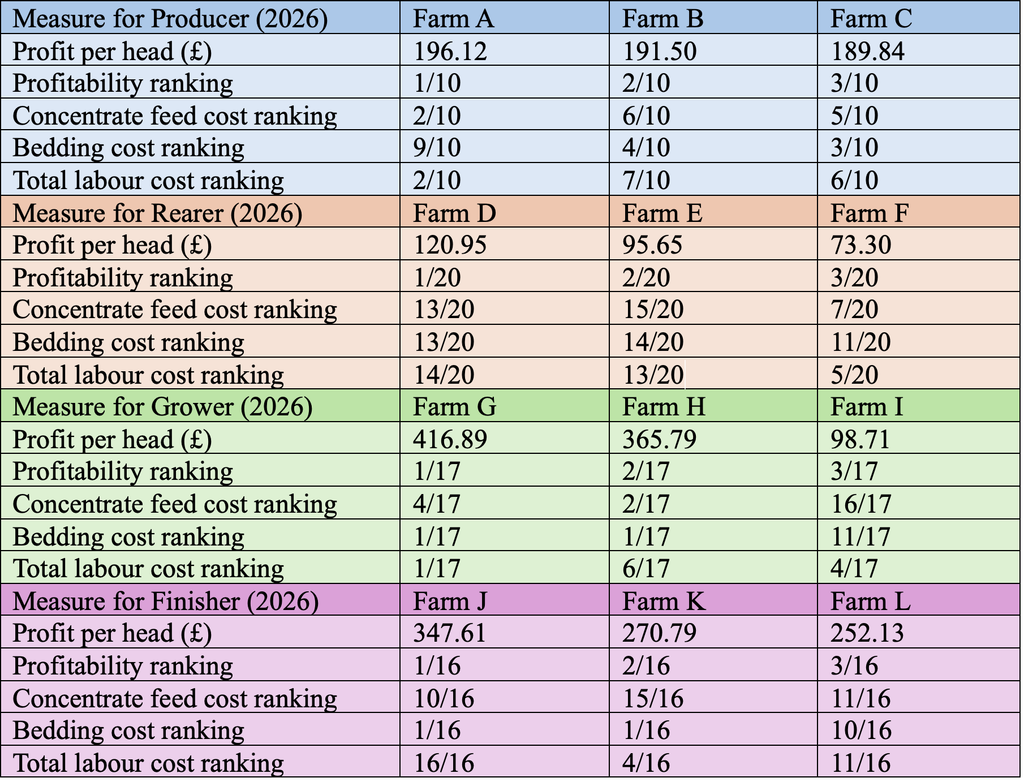
Table 1: Data from 2026 showing the three most profitable farms in each system and their ranking in terms of cost. Note the lower number for profitability is more profitable and the lower ranking number for costs symbolising lower spend e.g. 1/10 for feed means the farm spent the least of all farms on feed.
The 2026 data showed no consistent relationship between expenditure on concentrate feed, bedding or labour and profitability across the four production stages. Some of the most profitable farms kept costs low, while others spent considerably more on certain inputs.
For example, two of the most profitable growers had among the lowest bedding costs, while the most profitable finisher recorded the highest labour expenditure. This highlights the importance of looking beyond individual costs to understand overall farm performance.
For farmers, the priority is to assess value for money rather than simply minimise expenditure. The Cost of Production data shows no single cheapest approach to wintering Wagyu cattle. Regularly review feed efficiency, bedding use and labour requirements, comparing costs with daily liveweight gain, time on farm and sale value. The aim is to identify where spending delivers a return and where efficiencies can be made without compromising growth, health or welfare.
Download your winter checklist.
Download your free winter checklist by clicking here or on the image below.